


Why fintech transaction volumes don't matter unless you also know the net take rates

Original tweet thread:

Full post:
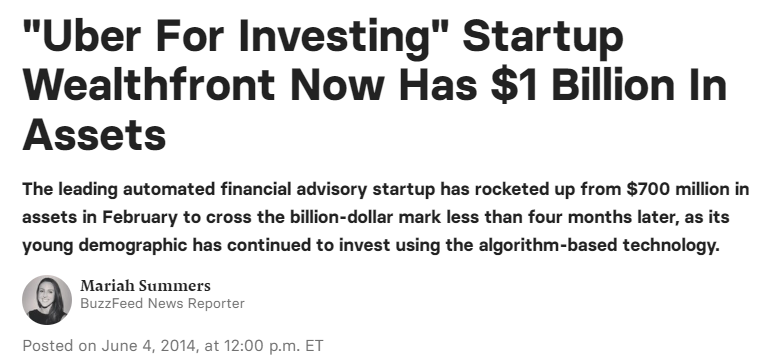
It's crazy to see how excited people get when they see another fintech cross $1B in volume, like it matters on its own.
The secret that they're not telling you is that fintech transaction volume is basically a useless vanity metric, unless you also know "net take rate".
So what is a net take rate in fintech anyway?
It's the revenue that a fintech gets for every dollar in transaction volume, net of reimbursements / discounts / cash back. You'll see it as a percent (or in bps if you tryna be fancy) of volume.

Note: though this is "net" take rate, it's not a profitability / margin metric. We only remove direct costs of revenue to reflect revenue fairly.
More on the best fintech margin metric (which remove direct costs of service (COGS) & variable OpEx) -
Since different fintechs have different business models, transaction volume AND the take rate is going to vary a lot.
I dug through financials for 6 types of modern fintechs to show you what $1B in volume really means for business model so you don't get lost in the hype.

#1 The Asset Manager / Robo-advisor
They may have been the first to hype volumes without take rate context, maybe b/c their take rates are so low.
Volume Metric: Assets Under Management (AUM)
Take Rate Metric: Annual management fee % AUM
Let's check out an example.
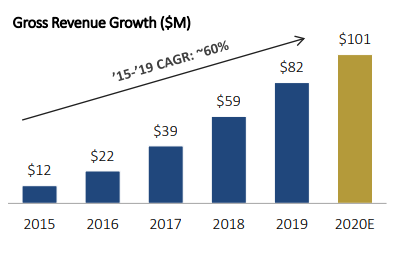
We'll use @PersonalCapital (PC) at acquisition, one of many modern fintech asset managers that rep volume growth. But asset managers earn their fee annually on AUM so it takes a LOT of AUM to get scale. PC had higher take rate b/c of hybrid human/robo model but still low.
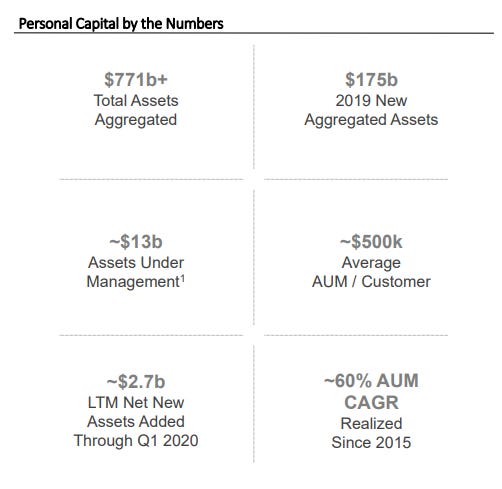
Based on the metrics, it would take a long time for incremental volume to add much revenue.
Volume: $13B AUM (after 11 yrs)
Take Rate: ~0.8% per yr
So adding $1B in AUM (+8%) only adds $8M per year in revenue.
#2 The Corporate Spend Platform
Going corporate w/ credit can mean higher interchange & steady volume but net take rate matters since most offer cashback that eats up revenue.
Volume Metric: Purchase Volume (PV)
Take Rate Metric: Interchange Rate, net of cashback % PV
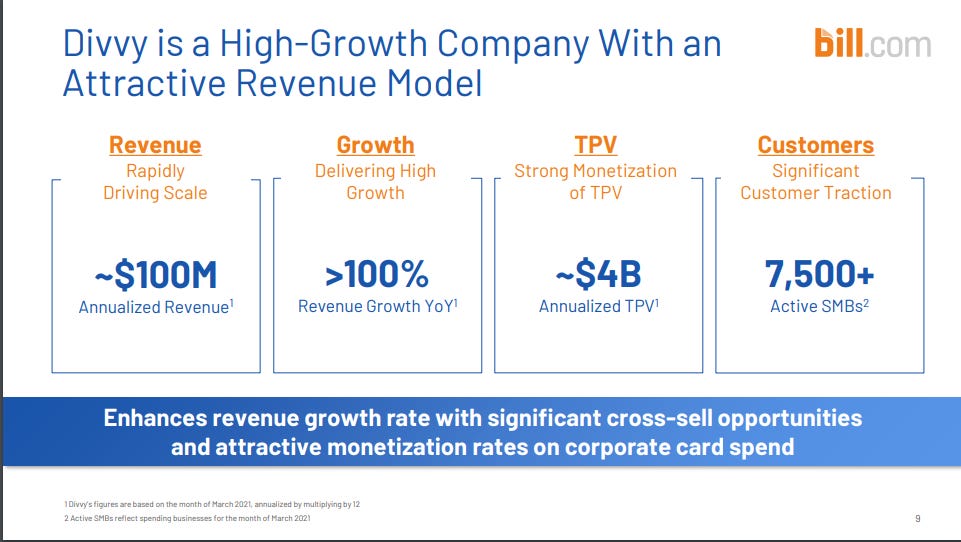
Let's use @Divvy at acquisition. We can get purchase volume and revenue from M&A deck BUT you need their 8-K to find cashback (which they sneakily throw in S&M) but which should really net against revenue. Divvy had lower cashback than others but still a lot!
10/24 Because of the cashback, take rates aren't much higher than debit & volume growth can take longer.
Volume: $4B annualized PV
Take Rate: ~2.5% gross interchange * (1 - 33% cashback) = ~1.7%
So adding $1B in purchase volume (+25% on annual PV) adds $17M per year in revenue.

#3 The Stock / Crypto Exchange
Exchanges are notorious for talking about massive volumes so take rates show just how much they actually make when someone trades on an exchange.
Volume Metric: Trading Volume (TV)
Take Rate Metric: Transaction Revenue % TV
Let's use @Coinbase as an example (FYI @Robinhood weirdly doesn't report trading volume?!). Not sure why CB reports assets on platform as though it matters when they make most of their money only on trading volume. But nice to see Trading Volume at least mentioned.
While Coinbase has insanely high volume, it's a lower take rate than most fintechs, so need lots of volume to drive revenue (which they have).
Volume: $327B in Q3'21
Take Rate: ~0.4%
So adding $1B trading volume (+0.1% on annualized vol) would add $4M per year in revenue.
#4 The Personal Loans Platform
Lending fintechs actually get in the news a lot b/c of high interest rates / APRs (a part of take rates) but volume is another part of the story.
Volume Metric: Loan volume (LV) originated
Take Rate Metric: Interest rate, net of fees % LV
Let's use @Upstart as an example. Easy to get excited about ~12% avg interest rates as a potential take rate, but note that they pay direct fees to originating banks AND that borrowers can also default w/o paying. And loan volume less recurring than other fintech volume.
Lenders still end up with very high take rates comparably, but volumes are also harder to scale.
Volume: $3B Q3 '21
Take Rate: 7.3%
So adding $1B originated loan volume (+8% on annualized originations) would add $73M per year in revenue.

#5 The Payment Processor
Payment Processors hype massive volumes but since they don't drive the volume, they have to give a lot back in revenue share which affects take rate.
Volume Metric: Processing Volume (PrV)
Take Rate Metric: Revenue, net of revenue share % PrV
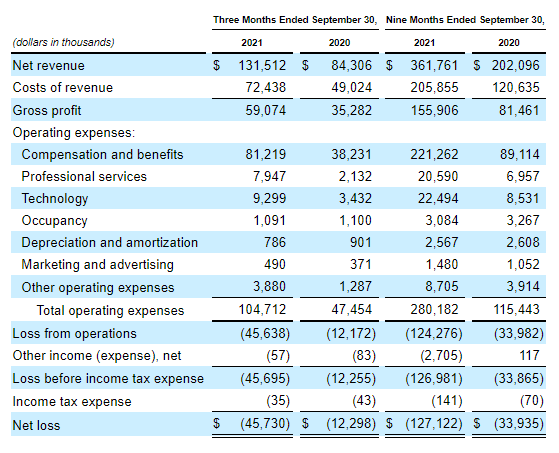
Let's use @Marqeta as an example (though as a card issuer, they can also charge customers on % of interchange that pure play processors can't). It's nice that they net out revenue share from gross revenue, but they prob only do this so we can't tell what they give away.
In any case, despite high volumes, they have a low take rate after revenue share, so need a lot of volume to make up for it.
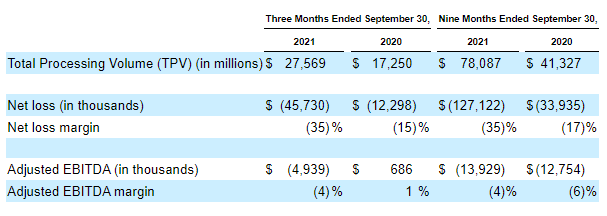
Volume: $27B in Q3'21
Take Rate: ~0.5%
So adding $1B processing volume (+1% on annualized vol) would add $5M per year in revenue.
#6 The International Transfer Platform
Money transfer platforms rep huge volumes since people convert currency back and forth when traveling so take rate helps illustrate business model.
Volume Metric: Transfer Volume (TrV)
Take Rate Metric: Revenue % of TrV
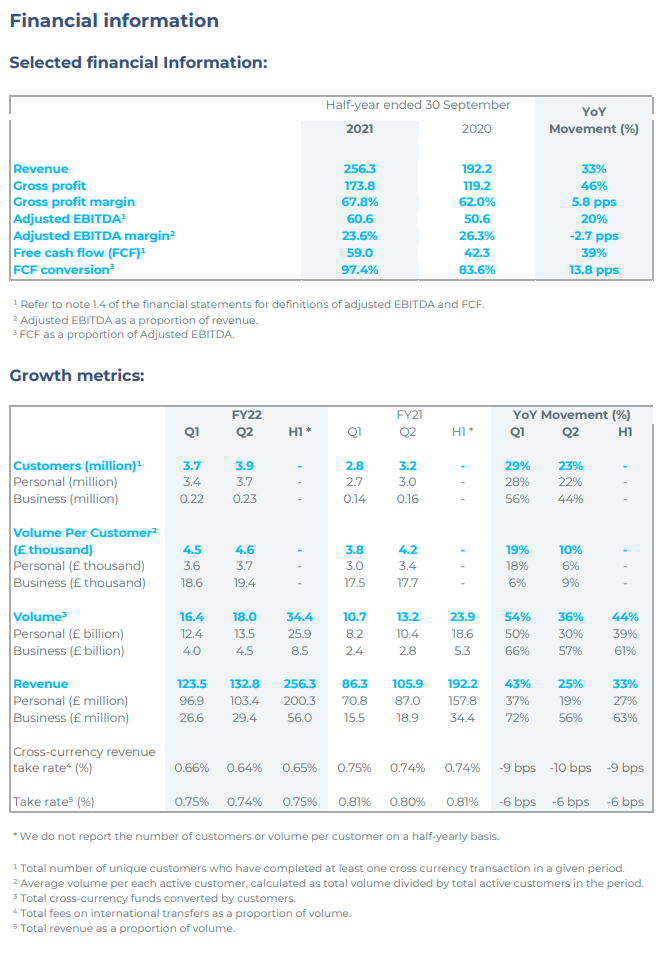
Let's use @Wise as an example. They're actually "smart" in that they claim lowering take rates is all part of their plan (and it's apparently working!). But I do like their transparency - one of the few to calculate take rate as a metric to make my life easier.
When we dig in, you see that take rates are still pretty high on volume (higher than trading & payment processing!) but lower than debit.
Volume: $34B in H1'21
Take Rate: ~0.75%
So adding $1B processing volume (+1.5% on annualized vol) would add $7.5M per year in revenue.
Re: The Debit Card Neobank
TBD since there's no real public comp for pure play debit card neobank. CashApp hidden in Square. Dave & MoneyLion are mostly fee-driven. NuBank is mainly credit.
But here's a deep dive on debit volume and take rates -